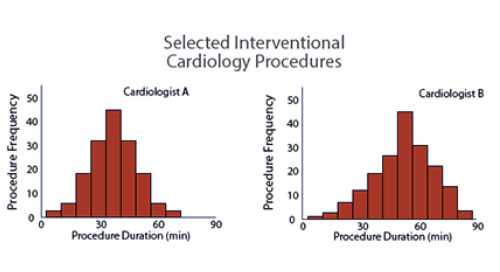
Histograms and Pareto Charts

Measures like the mean and standard deviation (covered in the Descriptive Data module) are useful methods for summarizing data, but we can also use pictures or graphs to gain a clearer understanding of process performance. The goal remains the same: how do our processes perform and how much do the outcomes of interest vary? Histograms and Pareto charts are visual displays that help us answer these questions. These methods also provide clues about the types and causes of variation we see in our processes of care.
Course Details
In this course, you will learn:
- Define histograms and Pareto charts
- Explain the value of using histograms and Pareto charts for quality improvement
- Interpret histograms and Pareto charts
External URL:
Course:
Certificate:
Degree:
